Data Detective
Charts encode data with marks, heights, areas, and scales, so matching a category to its mark lets us read, compare, and rebuild the underlying values.
MathematicsAges 7-12~10 min🎙️ Voice tutor
Play freeNo account needed
What your child will figure out
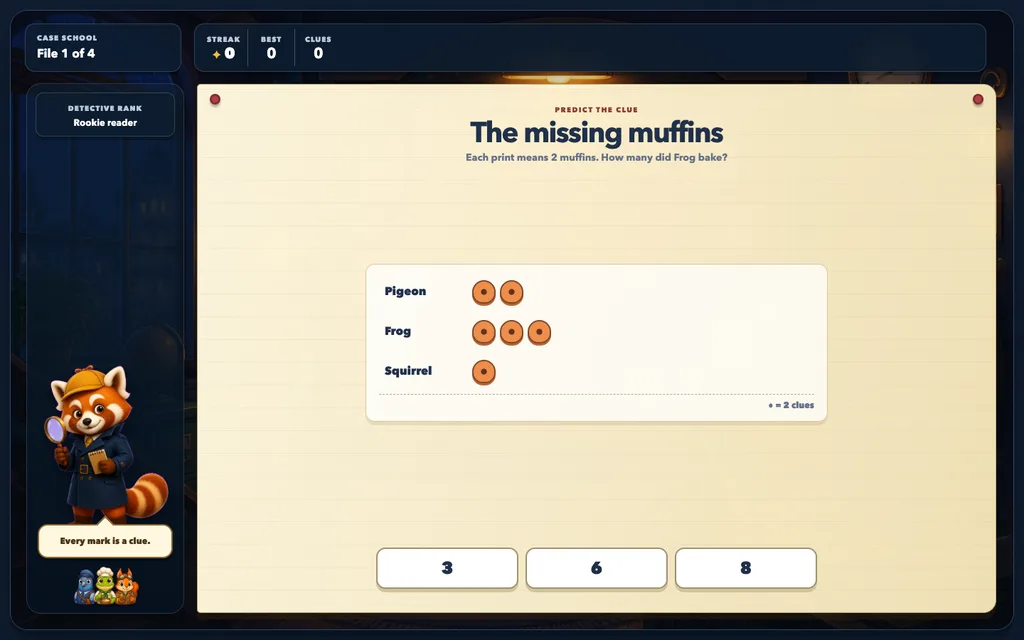
- Use a pictograph key to convert picture marks into a category value.
- Read exact, most, and least values from scaled bar charts.
- Compare two chart categories and calculate how many more one has than another.
- Build a bar whose height faithfully represents a supplied data value, then transfer chart reading across generated pictographs, bars, and pie charts.
The levels
- The missing muffins
Predict a pictograph value, inspect the key, observe the decoded total, and explain how each mark contributes.
- Footprints at midnight
Read a scaled bar chart and identify the greatest category value using bar height and axis evidence.
- The lantern gap
Compare two bar heights and find the difference rather than repeating either original value.
- Rebuild the alibi
Transfer the chart-scale relationship by constructing a missing bar from raw notebook data.
Ready when they are.
Play Data Detective free — no account, no card.
Play Data Detective free